

| About |
| Home |
| RO method |
| News Archive |
| Contact |
| Search |
| Documentation |
| Product Documents |
| Publications |
| ROM SAF Reports |
| Visiting Scientist |
| User Workshops |
| Data & Software |
| Product Archive |
| Product Quality |
| NRT Monitoring |
| Climate Monitoring |
| Software |
| User Service |
| Helpdesk |
| Helpdesk History |
| UNS Notifications |
| RSS Feeds |
| Registration |
| Login |
| NWP Model and Data Flow | Matched Occultations | Map plots | Desroziers plots | Monitoring Description |
Monitoring of NRT Products: Desroziers plots
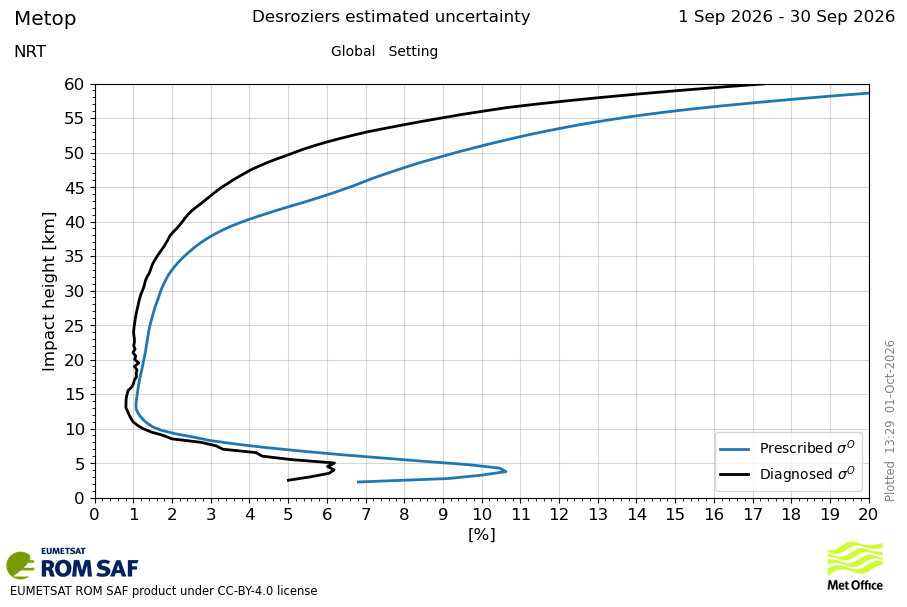
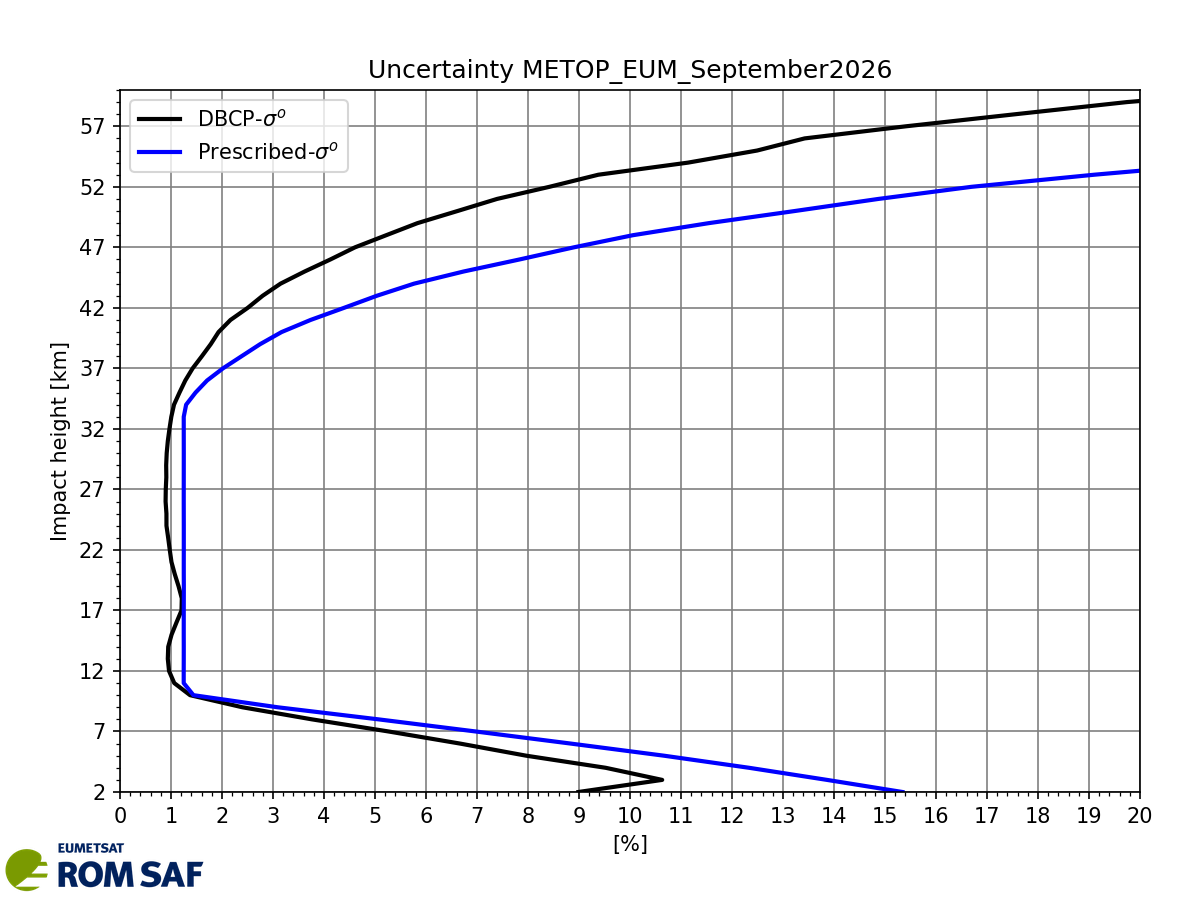
This page displays monthly RO Desroziers observation uncertainty estimates provided by MetOffice and ECMWF. Plots and data can also be downloaded from next demonstration products: Desroziers (MetOffice) and RO error stats (ECMWF). Click on the plot for a more detailed description.
Note that the Desroziers diagnostics are a consistency check on the input covariances provided to the data assimilation. They can be used to provide updated estimates of observation-, background- and analysis-error covariance matrices. However, these estimates depend upon the matrices which are provided as input, so should be carefully considered before being used.
Interpretation of diagnosed errors:
It is important to note that the diagnosed and prescribed observation errors should not be interpreted as pure measurement uncertainties. They represent the effective errors seen by a specific data assimilation system and may include contributions from forward-model error, representativeness error, and other sources of mismatch between the observations and models. Consequently, different NWP centres may diagnose different error estimates for the same GNSS-RO observations owing to differences in their models, observation operators, and assimilation systems.

|

|

|

|

|

|
|
The ROM SAF products are licensed under the Creative Commons Attribution 4.0 International License (CC BY 4.0) by EUMETSAT. Whether you're displaying the product as-is or if you have used it as input data, please use the attribution suggested on ROM SAF usage policy and acknowledgement.
|
|||||